|
Welcome to NCAR's GIS Initiative Climate Change Scenarios GIS data portal.
This portal is intended to serve a community of GIS users interested in climate change.
The free datasets of climate change projections can be viewed on-line and/or downloaded in a common GIS (shapefile) or text file format.
Many 2D variables from modeled projected climate are available for the atmosphere and land surface.
These climate change projections were generated by the NCAR Community Climate System Model, or CCSM,
for the 4th Assessment Report of the Intergovernmental Panel on Climate Change (IPCC).
New:
-
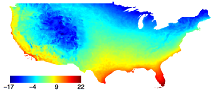
In addition to global CCSM climate projections, downscaled projections of monthly mean temperature and total precipitation for the contiguous United States are now available.
The downscaled dataset was produced using a statistical downscaling method.
-
Climate change projections from the Community Climate System Model
(CCSM-3) are generated on a Gaussian grid, which is commonly used in
scientific modeling. With a Gaussian grid, each grid point can be
uniquely accessed by one-dimensional latitude and longitude arrays (i.e.
the coordinates are orthogonal). In the CCSM model output,
distributed here, the longitudes are equally spaced at 1.40625�,
while the latitudes vary in spacing from 1.389� to 1.400767�. Due to
irregular nature of the gridded CCSM model output this portal
distributes the datasets in a point shapefile format, where each
point represents a centroid of a corresponding CCSM grid cell.
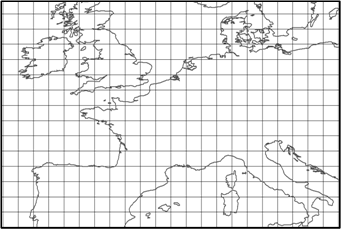
To more accurately represent a continuous surface of global climate,
we are providing a global /polygon /dataset for use with the CCSM
modeled climate projections. This polygon layer was derived using
the 4 corner coordinates, based on latitude and longitude, for each
grid cell of the CCSM outputs. This creates irregular, rectangular
polygons, as in a Gaussian grid of the original model output. Click
here for more information.
-
A tutorial on how to analyze climate projections from the CCSM in a GIS is now available.
In this demonstration, we compare model output of a present-day climate simulations with future climate projections.
To download the tutorial, click here.
To access data, you must register, login and accept data disclaimer. Please read data disclaimer carefully.
Thank you for visiting GIS Climate Change Scenarios website.
This GIS portal is complimentary to other IPCC data distributing portals (e.g., Program for Climate Model Diagnosis and Intercomparison (PCMDI),
and the Earth System Grid (ESG)), where complete data archive is available in common atmospheric data formats.
|